The Infographic: Content Marketing's New Secret Sauce?
We've asked Bob Zeni, brand strategist, communications development expert and infographics advocate, to explain how marketers can effectively integrate infographics into their mix of content marketing services.
Q: What are the key factors in the rising popularity of infographics in today's content marketing mix?
Zeni: With the virtual tsunami of information out there, content marketers have to work harder than ever to compete for "eyeballs," and that's what visual information does best — it catches the eye. But it does a lot more than that. Getting that initial attention is just the first hurdle for marketers. They need to hold on to it long enough to get their message across and understood.
Infographics help address both of these challenges. By nature, an infographic is designed to stand out visually while conveying information in a more succinct, at-a-glance format. This is a real advantage to business marketers who understand that their audience, while hungry for information, has precious little time to consume it.
Q: The term "infographic" is relatively new, yet communicating visually seems to be a practice that goes back to the days of storytelling through carvings on cave walls. Is there a difference between the two?
Zeni: Good question. The label "infographics" is being slapped on anything even remotely visual. But data visualization and an infographic are very different.
Data visualization is the graphic display of information — numbers, words and/or concepts — in a way that clarifies their relationships, such as a chart or graph.
An infographic, on the other hand, is a self-contained tool for communications that combines text, data and images to create a story that entertains, informs or persuades. It requires a narrative — a beginning, middle and end — that adds a framework to understand the importance of the data. The number of so-called "infographics" out there that answer to this description are by far in the minority.
Q: From marketers' point of view, the concept certainly seems to have merit, but is it really worth the time and investment — $1,500 to $3,500 — to add a high-quality infographic to their messaging?
Zeni: Yes. A marketer's message is only as valuable as the target audience it reaches and engages. Most people are visual learners, and the statistics on the marketing implications of that are indisputable. For instance, an analysis by the marketing agency Web Liquid found that highly visual content on the Internet is twice as likely to be read as text-only articles.
And according to Colin Ware, who authored Information Visualization, infographics also help people retain information, as the graphics are able to extend the reach of our memory systems. They do this by instantly and constantly drawing on nonvisual information stored in our long-term memory. One study found that after three days, a user retained only 10-20% of written or spoken information but almost 65% of visual information.* In another study, researchers looked at 46 experiments comparing pictures with text to text used alone. All but one of the studies showed that including pictures improved memory or comprehension. In one case, a group following directions in text illustrated with diagrams did an amazing 323% better than a group following the same directions without the illustrations.** Social media site Mashable claims that its infographic posts are retweeted three times more often than its text-only posts.
Q: Do you see infographics as a replacement for text-oriented content like newsletters and white papers?
Zeni: No, not a replacement but definitely an enhancement. An infographic can reduce the amount of text otherwise necessary to explain and inform. A well-attributed infographic is probably the most efficient and effective way to establish your expertise as a thought leader on the subject at hand. And, as I mentioned earlier, unlike using text alone, adding infographics increases the likelihood of greater social media sharing, and higher search engine rankings.
Q: Are there any tips you'd like to share to maximize the viral impact of infographics that you've just described?
Zeni: �The title and/or introduction to your infographic should be optimized for SEO by using strategic keywords. This is because while PNG and JPEG infographic formats are recommended for reduced download times, keywords contained within them cannot be picked up by search engines.
Your infographic should be in a vertical format, so the story is easily scrollable; this is a major advantage when the infographic is viewed on mobile devices. The infographic itself should be as succinct as possible.� Far too many infographics get carried away with data. They contain an overwhelming number of charts and graphs. If the reader needs to keep scrolling and scrolling to get to the conclusion, you're being counterproductive. Infographics are designed to make data make sense, not create more data.
Q: You stated earlier that a true infographic combines text, data and images to create a story that entertains, informs or persuades. How do those components play out when deciding what your infographic should look like?
Zeni: It depends on what you're trying to accomplish and who the intended audience is. In the corporate, financial and science arenas, the Academic model is used most often. The design and content tend to be more formal, using a minimum of subtle colors. (A more in-depth description of this approach can be found in The Visual Display of Quantitative Information by Edward Tufte.)
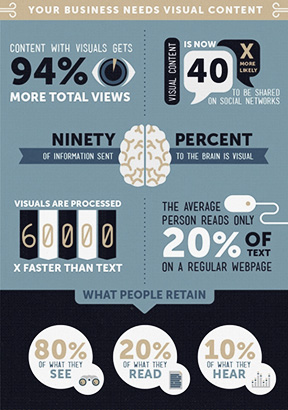
At the same time, the Editorial model works well in public relations, sales and marketing. The topics tend to be less formal and more visually appealing. The graphic design elements are typically more lively and feature bright, primary colors. (That model is well illustrated on the website Cool Infographics.)� That said, few infographics fall squarely at either end of the spectrum. Most are a blend of these approaches, as both have features that can be used effectively to build your brand. (See the infographic in the right-hand column that concisely makes the case for the value of infographics in complementing your B2B communications.)
As a thought-leader in the B2B space, you know that your reputation is built on respect for your knowledge. With that in mind, you'll want to feature unique, straightforward content that your customers can trust. Rely on your subject matter experts, or other sources of authority, to lend credibility to your data, as well as to any resulting conclusion(s).
Q: So, all things considered, how would you summarize the components of a well-crafted infographic?
Zeni: The best infographics contain the same components as all other effective communication tools: A well-considered strategy; original, authoritative content; and an appealing design that's consistent with your company's brand.
* Edgar Dale 1969.Cone of experience, in Educational Media: Theory into Practice. Wiman RV (ed). Charles Merrill: Columbus, OH.
** Effects of text illustrations: A review of research by W. Howard Levie, Richard Lentz, ECTJ, Winter 1982, Volume 30, Issue 4, pp 195-232.
Bob Zeni & Associates is a marketing communications agency specializing in the development of strategy, design and content for infographics. Bob has more than three decades of experience in journalism, graphic design, public relations and B2B marketing. To collaborate on creating memorable, high-impact communications that move clients, contact Bob at 708-466-4700 or [email protected].
|


 Follow us on Linkedin